

QA leadership metrics are the outcome-level measures, such as defect escape rate, requirement coverage, and release readiness, that show executives how QA reduces business risk. QA leaders who report them in real time, instead of in monthly spreadsheets, make their team’s impact visible and earn a seat in leadership conversations.
Introduction
You know your team caught the defect that would have taken down checkout on Black Friday. Does your VP of Engineering know? Do they know it happened because your regression suite covered a requirement nobody else remembered?
For most QA leaders, the honest answer is “not unless I build a report.” So the work that protects every release stays invisible, and when a Director or Head of Quality role opens up, the case for your impact is a spreadsheet you rushed together the night before.
This post covers the metrics leadership trusts and how to report them without the spreadsheet scramble.
Why QA impact stays invisible to leadership
QA data usually lives in three places at once: test cases in one system, defects in Jira or Azure DevOps, and automation results in Ranorex logs. Pulling them together is manual, slow, and out of date by the time it reaches an executive.
So leaders get test counts (“we ran 4,200 tests”) instead of outcomes (“we cut production defects by a third”). Test counts describe effort. Executives fund outcomes.
5 QA leadership metrics executives trust
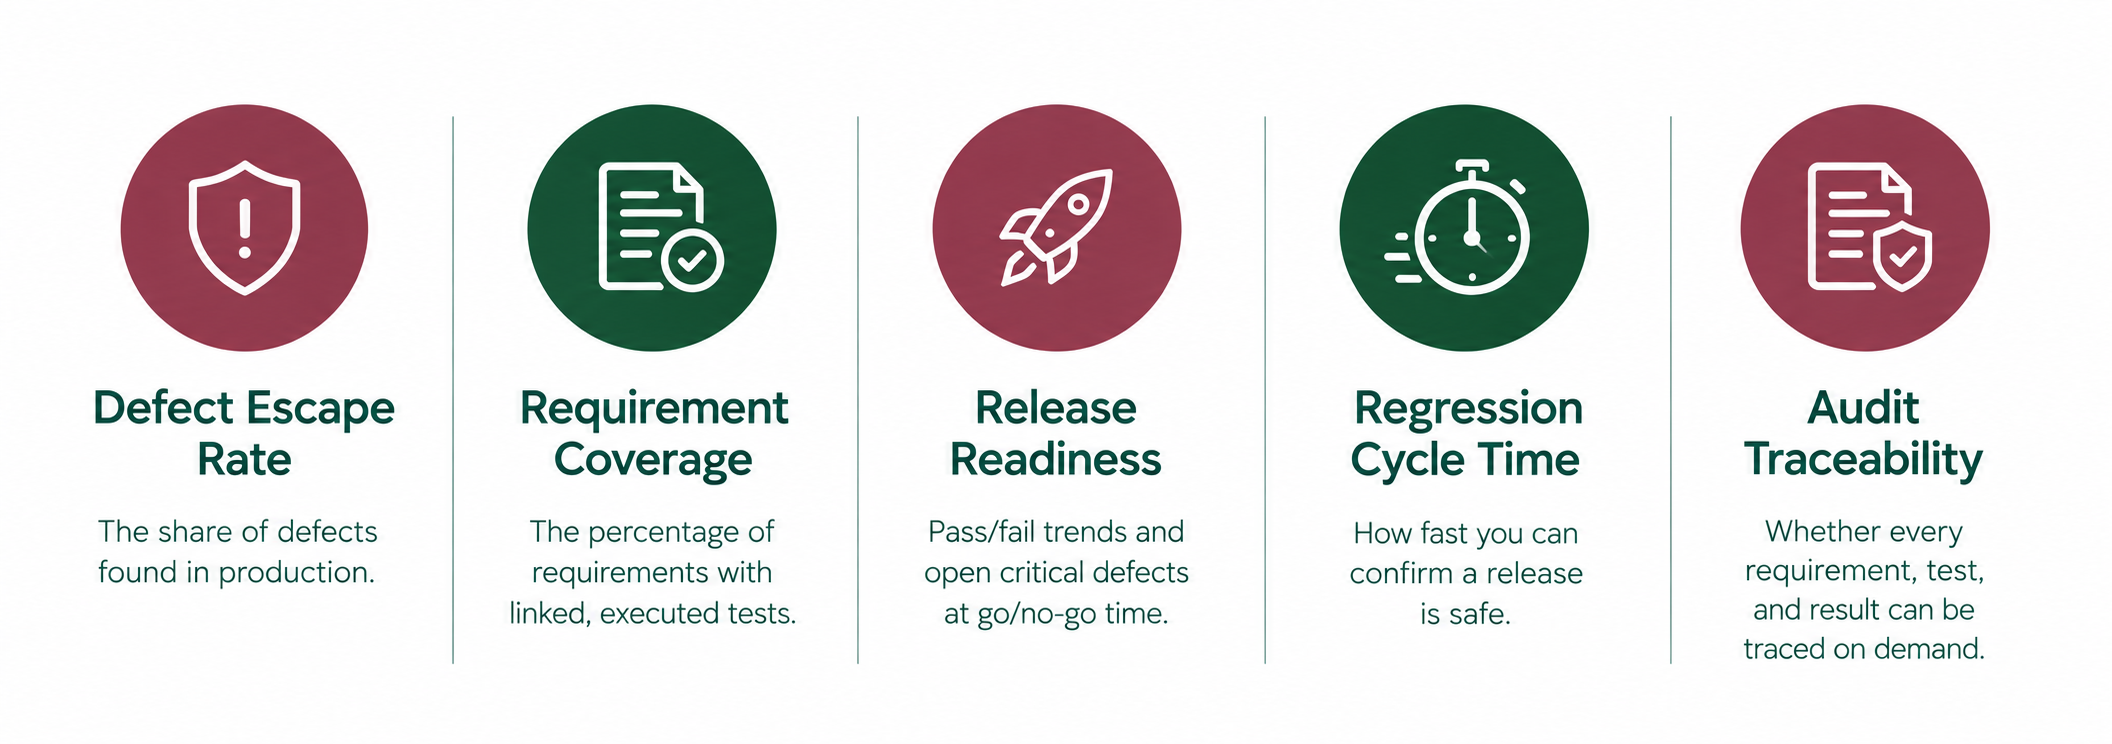
- Defect escape rate: the share of defects found in production. It’s the clearest signal of QA effectiveness.
- Requirement coverage: the percentage of requirements with linked, executed tests.
- Release readiness: pass/fail trends and open critical defects at go/no-go time.
- Regression cycle time: how fast you can confirm a release is safe.
- Audit traceability: whether every requirement, test, and result can be traced on demand for SOX, NIST, or ISO.
Spreadsheet reports vs. real-time QA reporting
|
|
Spreadsheet reporting |
Real-Time Reporting |
|
Freshness |
Days or weeks old |
Live |
|
Effort |
Hours of manual assembly |
Built in |
|
Traceability |
Partial, error-prone |
Requirement → test → defect |
|
Executive trust |
“Where did this number come from?” |
Source-linked and filter-free |
|
Audit readiness |
Scramble before audits |
Audit-Proof QA by default |
How QAConnector turns test data into leadership evidence
QAConnector is the QA management platform built by QA professionals to make this kind of reporting the default:
- Real-Time Reporting: live visibility into test progress, defects, and trends. No delays, no filters, so the numbers leadership sees are the numbers your team sees.
- Audit-Proof QA: every test logged, every result traceable, every requirement covered, with complete, structured records for SOX, NIST, and ISO conversations.
- TestGen AI: generates positive and negative test cases from requirements in minutes, so coverage gaps close before they show up in your metrics.
- Test Stack Integration: connects with Jira, Azure DevOps, and Ranorex, so data from across your toolchain feeds one source of truth.
- Built on Microsoft Azure: enterprise-grade security, reliability, and compliance that CIOs and auditors recognize.
When reporting is built in, you stop assembling evidence and start presenting it. That’s the shift from “QA manager who runs tests” to “quality leader who reduces risk.
FAQ:
What QA metrics do executives care about?
Executives care about outcomes tied to risk: defect escape rate, requirement coverage, release readiness, regression cycle time, and audit traceability. These show whether QA is protecting releases and the business, not just how many tests ran.
How do you report QA metrics to leadership?
Lead with outcomes and trends, link every number to its source, and keep reports current. A QA management platform with Real-Time Reporting removes manual assembly, so leadership sees live, trustworthy data instead of last month’s spreadsheet.
What is real-time QA reporting?
Real-time QA reporting gives live visibility into test progress, defects, and trends as they happen. In QAConnector, Real-Time Reporting pulls data across your test stack into one view, with no delays and no manual filtering.
How does traceability improve QA reporting?
Traceability links requirements, test cases, and defects, so every metric can be traced back to its source. That makes reports accurate, defensible in audits, and credible to executives who want to know where the numbers came from.
How can QA managers show their impact?
Track outcome metrics over time, report them in business terms, and make the evidence easy to access. When your reporting shows reduced risk release after release, your case for leadership roles builds itself.
Conclusion
Your team’s impact shouldn’t depend on a spreadsheet you build the night before a big conversation. With the right QA leadership metrics, reported in real time and fully traceable, you give executives what they need: proof that quality is reducing risk. For CIOs and Heads of Quality, that same visibility means audit readiness and release confidence on demand, on a platform built on Microsoft Azure.
See it for yourself: request a QAConnector demo and get your first Real-Time Reporting dashboard running.
Recent Comments