
Engineering teams don’t budget for surprises. But post-release defects and emergency fix cycles are almost never actually random — they’re the visible result of invisible QA gaps. The teams that stop being surprised are the ones with real-time visibility into what their QA is — and isn’t — covering.
QA blind spots aren’t a testing problem — they’re a visibility problem
If your QA reporting lives in spreadsheets, generates once per release cycle, or requires a manual data pull to answer a leadership question, you have a visibility problem. Not because the testers are doing bad work, but because the information isn’t accessible at the right moment.
A defect trend building for three sprints should be visible to engineering leadership after sprint one — not after it causes a release failure. A drop in regression coverage from a codebase change should surface the same day — not when a defect escapes. The pattern between reported defects and a specific feature area should be trackable continuously — not reconstructed after a production incident.
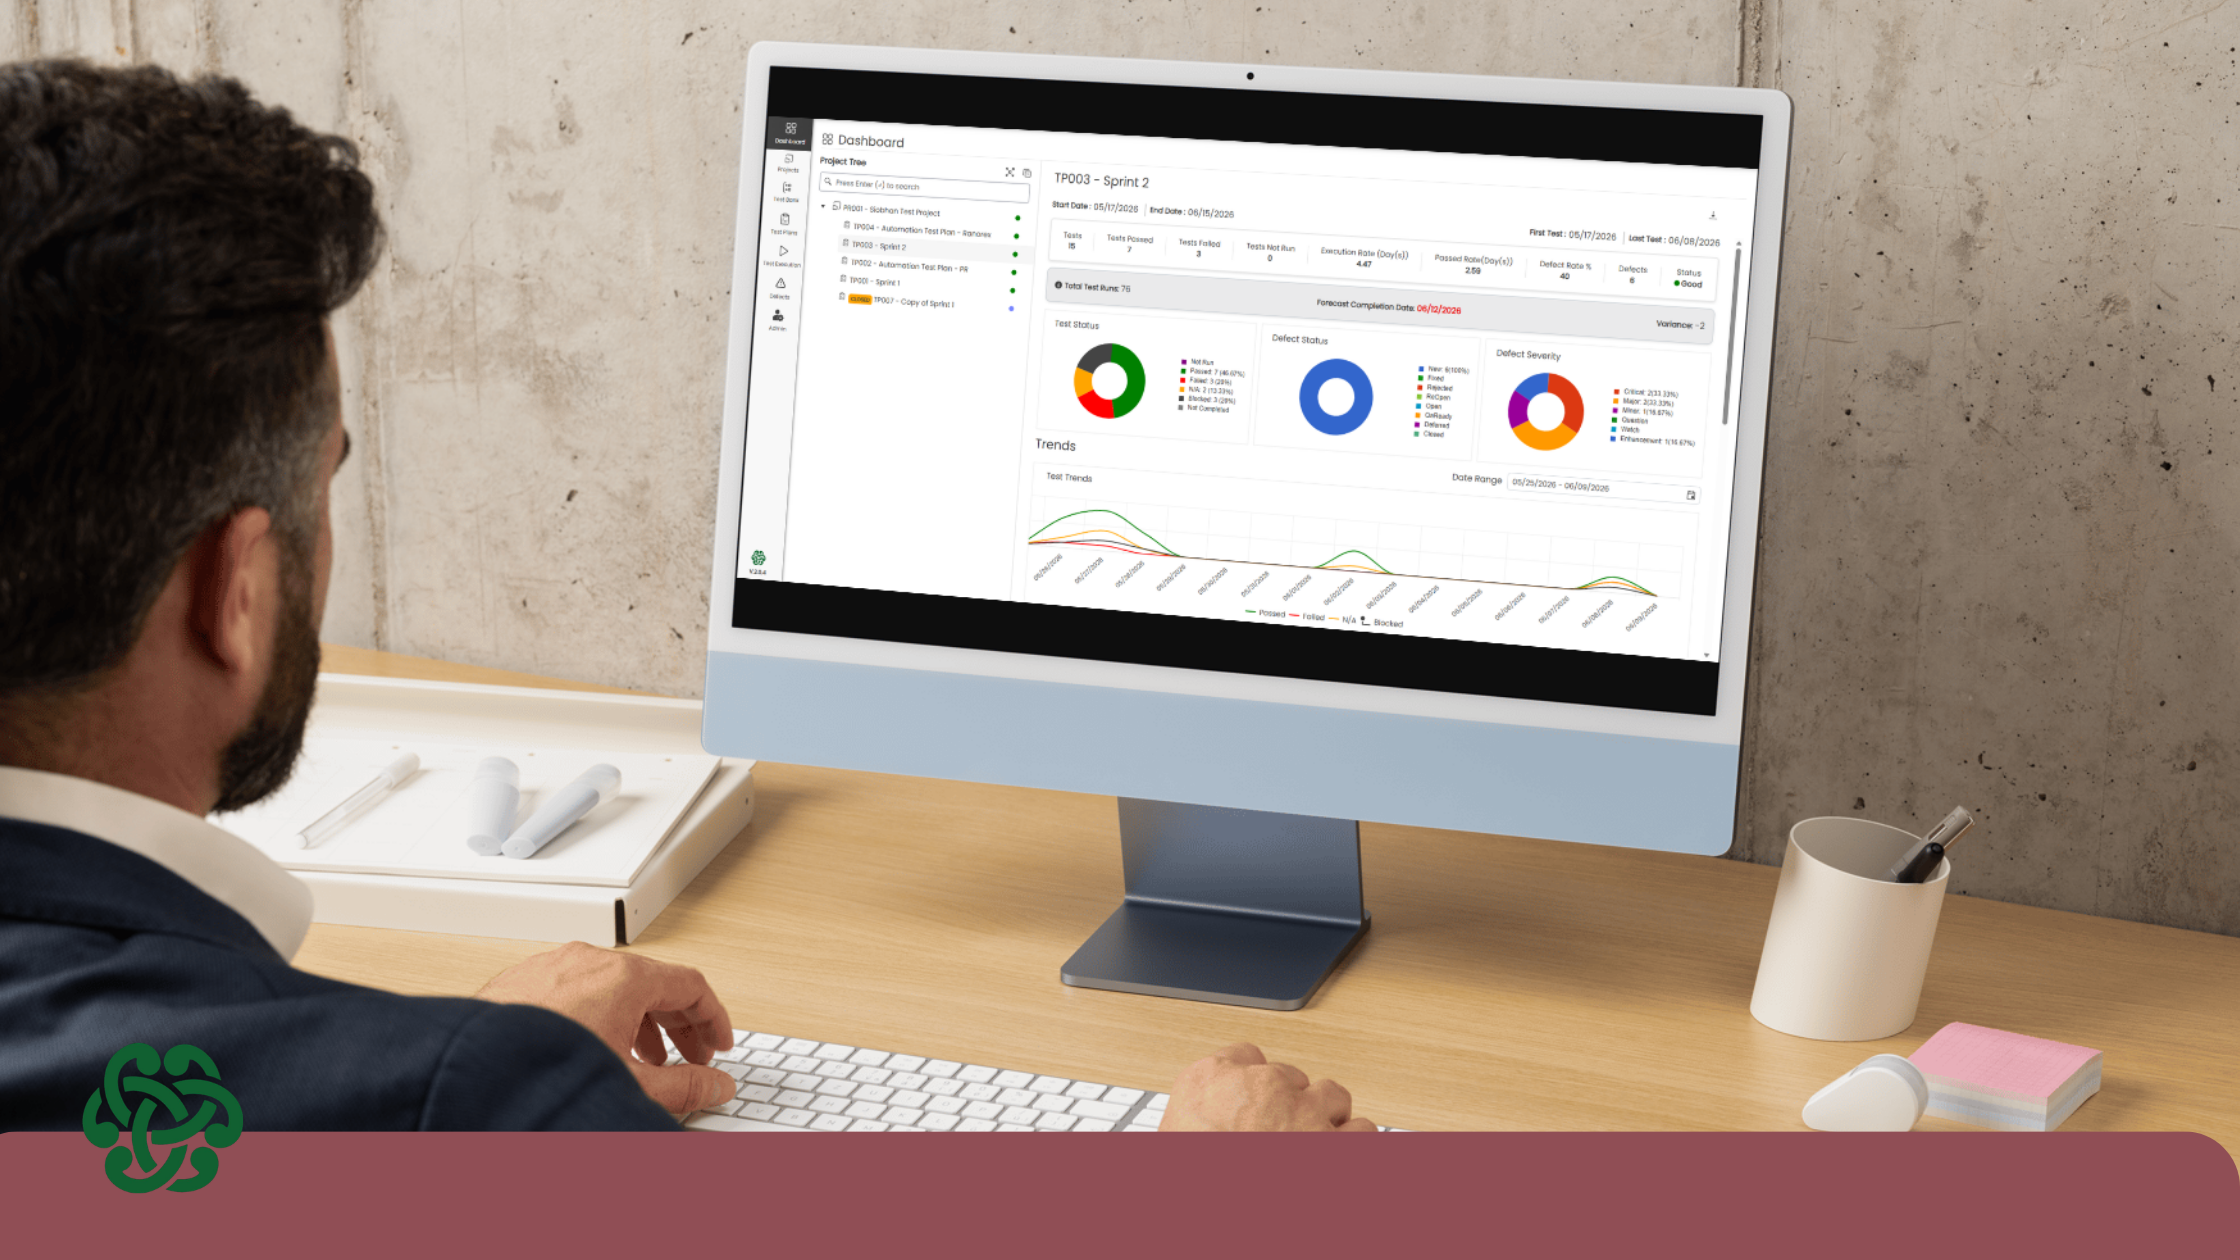
This is what Real-Time Reporting in QAConnector is built to provide: a live, unified view of test progress, defect trends, and coverage state — without the export-filter-pivot workflow that turns reporting into a job in itself.
Five visibility gaps that turn into budget events
Most QA-related budget surprises share a common structure: something was going wrong for a while, but the data to see it wasn’t accessible to the people who could have acted on it.
- No visibility into defect trends across sprints
When defects are tracked per-sprint without a cross-sprint view, teams miss the signal that a particular component or feature area is accumulating technical debt. Fix cycles get attributed to complexity rather than to a drift in test coverage. QAConnector’s Real-Time Reporting surfaces cross-sprint defect trends as a continuous view — so QA leads and engineering managers can see acceleration in defect rates before it becomes a release blocker.
- Test coverage tracked separately from requirements
When requirements live in Jira and test cases live in a spreadsheet, the link between “what we committed to build” and “what we verified works” is invisible. This is the traceability gap that shows up in audits — and in post-release defect investigations. Audit-Proof QA connects every requirement to its test cases and execution results, producing the traceable, tamper-proof record that closes the coverage gap and satisfies both QA leads and CIOs.
- Automation results disconnected from manual QA data
Teams running automated regression alongside manual exploratory testing often have two separate result streams with no unified view. You know your automation passed and your manual tests passed, but the combined coverage picture is invisible. Test Stack Integration in QAConnector unifies results from Ranorex, Jira, and Azure DevOps into a single source of truth — so the full coverage picture is complete, not assembled by hand.
- No real-time visibility for QA leaders and executives
QA managers who need a status update shouldn’t have to call a meeting. CIOs preparing for an audit or a board review shouldn’t wait for a manual report. Real-Time Reporting in QAConnector gives every role the view they need: QA practitioners see test execution progress and defect detail; managers see coverage trends and risk indicators; executives see the audit-ready summary they need to sign off.
- Test planning detached from execution and reporting
When test plans are created in one tool, executed in another, and reported in a third, the planning assumptions rarely survive contact with reality. Coverage gaps that weren’t visible during planning show up as defects in production. QAConnector unifies test planning, execution, automation, and reporting in a single platform — built by QA practitioners for the exact workflow that creates this fragmentation. The CelticQA Solutions blog covers the process side of this problem QAConnector is the platform that closes the visibility gap.
What CIOs should be asking about QA visibility
For the engineering leaders funding QA, the relevant question isn’t “are we running tests?” It’s “can we see what the tests are telling us, in time to act?”
The metrics that inform real decisions:
- Defect escape rate — what percentage of defects are making it past QA to production?
- Regression coverage by release — is coverage holding as the codebase grows?
- Defect trend by component — are specific areas accumulating more issues over time?
- Requirements coverage — is every committed requirement verified by a traceable test case?
- Mean time to detect — how long between a defect being introduced and QA surfacing it?
None of these are complex metrics. All of them require data to be in one place, accessible without a manual pull, and updated in real time.
From invisible risk to visible coverage
Budget overruns don’t require anything dramatic to prevent. They require consistent visibility into what QA is covering and what it isn’t — before a defect escapes, not after. QAConnector is built specifically for this: a unified QA management platform that gives QA teams the workflow they need and gives leadership the visibility to make informed release decisions. Built on Microsoft Azure for enterprise-grade security and compliance.
See what Real-Time Reporting looks like for your team’s QA workflow. Schedule a demo.
FAQ: The Questions People Actually Ask
What is QA reporting software?
QA reporting software provides visibility into test execution progress, defect rates, coverage metrics, and quality trends — in real time and across the testing lifecycle. A QA management platform like QAConnector unifies data from test planning, manual execution, and automated testing into a single, accessible dashboard for QA teams and engineering leadership.
How does real-time QA reporting prevent budget overruns?
By making defect trends, coverage gaps, and regression results visible to the right people at the right time, real-time reporting allows engineering and QA leadership to act on risk before a defect escapes to production. Post-release defects cost 40–100x what the same issue costs to fix earlier in the SDLC — visibility creates the opportunity to catch them earlier.
What QA metrics should a CIO review before a release?
Key metrics for CIO-level review: defect escape rate, regression coverage percentage, requirements traceability coverage, defect trend by component, and mean time to detect. These answer the fundamental release question: have we verified what we committed to build, and are the right things working?
What is Audit-Proof QA?
Audit-Proof QA is QAConnector’s capability for maintaining complete, traceable QA records — connecting every requirement to its test cases, execution results, and outcomes. It produces the structured documentation that demonstrates testing coverage to auditors, compliance teams, and internal stakeholders, aligned with SOX, NIST, and ISO frameworks.
How does QAConnector integrate with Jira and Azure DevOps?
QAConnector integrates with Jira and Azure DevOps through Test Stack Integration — connecting test planning, execution data, and defect tracking into a unified view alongside the project management workflows QA teams already use. This eliminates the export-and-merge workflow that makes QA reporting time-consuming and error-prone.
For QA teams spending too much time assembling reports and too little time acting on them, schedule a QAConnector demo at qaconnector.com/demo/ and see what real-time visibility looks like for your stack.
Recent Comments